


Today in Pre-Calculus, our goofy math teacher showed us a funny video of him and his BFF rolling a skateboard down his driveway off three different ramps off varying height; 7 inches, 14 inches, and 21 inches, this is his idea of a fun weekend... Yikes! He showed us the video of them pushing the skateboard down the ramp down his 64 foot long drive way, and then, due to the fact that his driveway was slanted in the opposite direction, how the skateboard rolled the other way. My predictions were somewhat alike to the actual graph, as the ramps decreased in height, my predictions increased in accuracy. The graph goes up and back in all cases except the 7 inch ramp, and therefor the graph changed from going up and back down to just going out. The domain and range for the graphs varied slightly, decreasing with the height of the ramp; the 21 inch ramp had a domain of 37 seconds, and a range of 66 feet, the 14 inch ramp had a domain of 37 seconds and a range of 56 feet, while the 7 inch ramp had a domain of 16 seconds and a domain of 43 feet. The graphs all had a very different maximum, but the same minimum; the maximum for the 21 inch ramp was 66 feet, the 14 inch ramp had a maximum of 56 feet, and the 7 inch ramp's maximum was 43 feet, but all the minimums were 0. The 21 inch ramp's graph had the fastest rise because the ramp was the highest and therefor, making it the fastest accelerator. However, the 14 inch and 21 inch ramps both had the same deceleration rate because there was no force acting on them and the driveway was the same slope. All in all, a lot of fun and I really enjoy these projects even if they are goofy! Thanks Mr. Kelly! :)
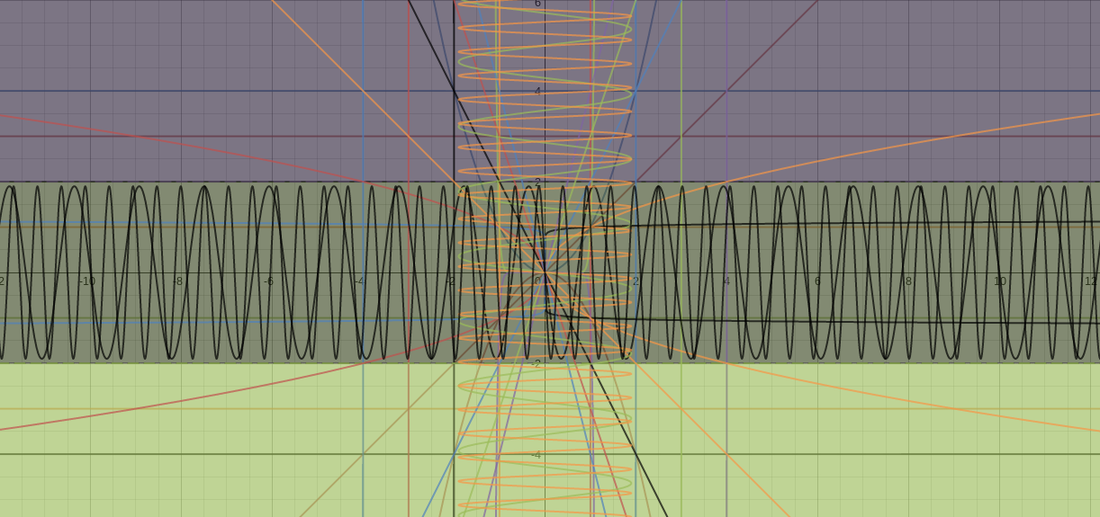
This is my experiment with functions using the online calculator, desmos.com. I had a ton of fun creating this work of art in class, and now, with my knowledge of functions, it makes a lot more sense than just typing in random numbers and hoping it looked cool when I was done. I learned about how using a greater than, or less than sign can shade the graph into different colors and that was really interesting to me. At first, when I didn't really know what I was doing and used a lot of constant functions, but once I messed around a little bit, I started using quadratic functions, absolute value functions, and even some sine and cosine functions. The squiggly lines are cosine and sine functions with sliders and they are really squeezed together. In the end, it was really interesting and I learned a lot.
|
AuthorMy name is Evelyn Bradley and I'm in pre calculus! Archives
April 2015
Categories |
 RSS Feed
